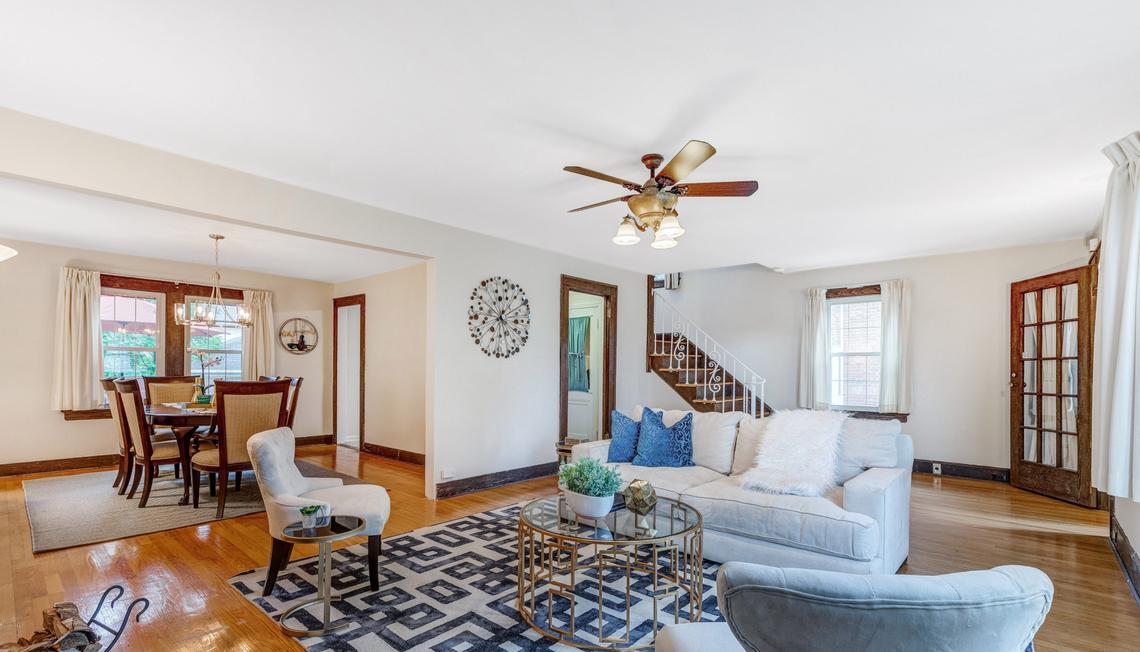
29 Colgate Rd., Maplewood
What’s the best time to sell my house in Maplewood, NJ? Sellers are always asking this question, and I always give them the same answer. The best time is when the timing works best for you personally. If you have school aged kids and need them to finish out the school year or would prefer to have your house on the market while your kids are away at camp, then those things are very important and should be the preeminent decision in your timing. The average days on market year-to-date (YTD) in Maplewood (for example) is 30 days, and most buyers are looking to close in 45 to 60 days, so we can look at a calendar together and back into an ideal listing date.
That being said, it is also vitally important to have the house in optimal showing condition when it comes on the market. We have only one chance to make a great first impression! So if you want to get your house on the market in the spring time and just can’t make all of the recommended preparation in time, then WAIT. I like to see my sellers in the strongest position when they go live on the market, so all of the cleaning, organizing, staging and repairs should be completed so that your “product” is very attractive to buyers.
Is there a bad time of year to list your house? The answer is no with a few exceptions– the last couple of weeks in December do get quiet as people are distracted with holidays. Better to wait until the after the New Year to list. If it’s a holiday weekend like July 4 or Memorial Day I would wait to list until the following week so that your first open house and weekend of showings doesn’t coincide with a long getaway weekend.
Let’s look at the numbers for the last 2 years to see what the data says about prime listing times. One can assume that the houses that closed in a particular month were listed 2 months prior. So an April 2018 closing would have meant a listing date in February 2018. The answers may surprise you.
In 2018 YTD, the following months are those where homes closed with the highest list price to sales price ratio:
- April 104.32% (listed in Feb.)
- July 104.04% (list in May)
- June 103.71% (listed in April)
[vr_spacer]
The month with the lowest list price to sales price ratio of closed homes YTD is January, with a ratio of 99.89 percent. So those homes were most likely listed in November 2017.
In 2017, the months for homes that closed with the highest list price to sales price ratio were:
- June 105.38% (listed in April)
- May 104.78% (listed in March)
- March 104.28% (listed in Jan.)
[vr_spacer]
October and December were the months with the lowest list price to sales price ratio of closed homes in 2017 with ratios of 100.08% and 100.77% respectively. So those homes were listed in August and October.
These are some takeaways. There could be a 4% differential in list price to sale price ratio based on what time of year you list. Surprisingly, early spring listing times in January or February (March and April closings) can very profitable despite the potential for snow and lack of spring flowers. The best month isn’t always the same year to year. Notice that the average list price to sale price ratios were down a bit in 2018 from 2017. We are starting to see some cooling of the market. Buyers are showing some price resistance. Remember these are averages so if your house is well prepared, well priced and easily accessible we will do well with it just about anytime of year.


 By submitting information, I am providing my express written consent to be contacted by representatives of this website through a live agent, artificial or prerecorded voice, and automated SMS text at my residential or cellular number, dialed manually or by autodialer, by email, and mail.
